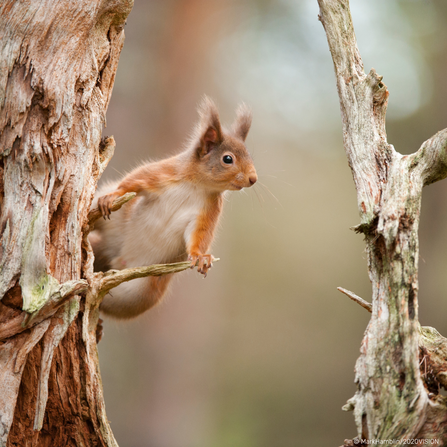
Red squirrel. Photo by MarkHamblin/2020VISION.

Red squirrel. Photo by MarkHamblin/2020VISION.
2025 marks the 13th year of RSNE’s annual spring survey, an ambitious project using citizen science to create a long-term dataset monitoring changes in red and grey squirrel range in Northern England (now also including the border area and Southern Scotland). While the annual spring survey is widely promoted and well-known, what most people may not know is that RSNE manage a database which holds lots of data provided to us by red squirrel groups, independent volunteers, and sightings from members of the public. As part of this Wilder Wednesday, I’ll be touching on the different data we hold, why we have it, and what it’s used for.
Most recently I’ve been working on processing and analysing the data gathered as part of the spring survey for 2025. Usually, we work only with the local red squirrel groups in Northern England, however this year squirrel groups from Southern Scotland have also helped organise and carry out surveys. This exciting development increases the area over which we can monitor changes in squirrel distribution and allows us to evaluate the effectiveness of the essential conservation work being carried out in these areas. In truth, without the huge amounts of effort put in by red squirrel groups it’s likely we would have lost many, if not all, red squirrel populations in this area. Since 2012 nearly 4,000 surveys have been carried out in total, and we want to say a huge thank you to red squirrel groups for their expertise and tireless effort; land managers for granting access to private land; and the funding generously provided by donors and supporters.
Overall, 237 tetrads were surveyed across 11 counties with a massive 84% of these carried out by volunteers. Of these, 213 were trail camera surveys, 23 visual transect surveys, and 1 singular feeder monitoring survey. As there are 3 different surveys, each was recorded using a different format. However, before we could map or analyse the data, we needed to process the raw records into a single consistent format without losing any data. After this, data points needed to be validated by comparing the supplied grid references against the survey’s tetrad ID. Once I had cleared up any queries and was happy with the data I began the fun part, mapping and analysis! I won’t give away all the results here, but we did see an overall decrease in both red and grey squirrel occupancy, the reasons for which will be published in the report which is coming soon.
As part of my work as Data Officer I regularly add records sent in from groups to the database we manage. As the groups are independent, each group usually uses a slightly different format. To help with processing these into a consistent format for upload, I have created a series of spreadsheets which have automated a large part of the process. This speeds up the processing but also flags if a record needs slightly more tweaking to fit within the Arc upload template I work from. As a result, records are uploaded as accurately as possible, which is essential.
One important point of note is the data shared with us is not ours, they are the property of the group which carried out the conservation effort. We adhere to a strict data-sharing agreement with the squirrel groups, and data is only used by us within the scope set out by the agreement. Groups are also able to upload their records directly to Arc and have their own dashboard where they can see their group records and records owned by RSNE. To facilitate inter-area work, different groups can agree to share data between themselves. Once we have that agreement, we can allow for other groups records to also be shown on the dashboard. This can help groups with planning work in terms of where squirrels have been seen.
Red squirrel groups generously sharing their data allows for us to build a single database for managing squirrel data in Northern England. Creation of a simple data flow is ideal, as it can get very complex when data moves between lots of different systems! The risk of duplicating or losing data is minimised and data verification is a much smoother process. A more robust dataset can only benefit conservation action, and in turn benefit red squirrels! Maintaining the squirrel data for Northern England is complex and wouldn’t be possible without the help of all our red squirrel groups. One of my favourite aspects of my role is getting to check in with the groups and have a chat while solving a data problem. I hope this blog has demystified some of the questions surrounding what happens with the squirrel data. I appreciate this was a whistle-stop tour, so if you have any further questions, please contact me at Emily.Frith@northwt.org and I’ll help as best I can. Keep an eye out for our spring survey report coming soon!